
Data Management
Introduction To Augmented Analytics Tools
Share
Overview
Augmented Analytics Tools save businesses time by automating repetitive data management tasks and providing AI-driven analysis that can be acted on quickly. Like a tree falling in the forest, data is only useful if it is accessible. Before you think too much on that failed metaphor, read on to learn the basics of what makes Augmented Analytics Tools tick.
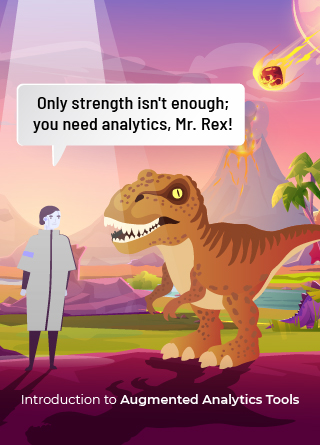
-(4).jpg.aspx "TechDogs-\"Introduction To Augmented Analytics Tools\"-Only Strength Isn't Enough:You Need Analytics,Mr.Rex!")
Data is important but that doesn’t mean it’s exciting, actionable, or easy to decipher — at least, not unless you’re good at math, love interpreting data and adore spreadsheets. It takes statisticians, scientists, analysts and the occasional mathematician to interpret data, translating it into something the rest of us can understand. In a data-driven marketing world that can be… problematic.
Hollywood typically glosses over the dry, repetitive, often frustrating job of data analysis by casting scientists and analysts into misunderstood (often sexy) heroes.

Every disaster movie from Jurassic Park to Twister to Contagion has a world-weary (attractive) scientist peering ominously at a screen/printout/map while trying to communicate the dawning horror of what’s about to happen in words we (non-scientists) can understand.
Since Jurassic Park’s 1993 debut, the use of data in our everyday lives has become much more ubiquitous. This is particularly true for businesses. We use data — and lots of it — to evaluate every
stage of the customer buying journey. Data touches nearly every role within the sales, marketing and operations ecosystem. However, not every marketer, salesperson, CEO, or account rep is an expert at interpreting data. Luckily, they don’t have to love data or understand the nuances of data science because we have Augmented Analytics Tools. Let’s look at what they are.
What Are Augmented Analytics Tools?
Augmented Analytics Tools use Machine Learning and Artificial Intelligence (ML/AI) to interpret data. If you, like us, are rewatching every single episode of Star Trek: The Next Generation, then you can think of Data, the famous android who had many interstellar adventures, as a type of Augmented Analytics Tool. (What we mean by that is Data is perpetually poring over huge chunks of data, analyzing it and interpreting it for his human co-workers!)


The official definition of augmented analytics, per Gartner, is, “the use of enabling technologies such as Machine Learning and AI to assist with data preparation, insight generation and insight explanation to augment how people explore and analyze data in analytics and BI [business intelligence] platforms.”
Our unofficial definition is that Augmented Analytics is the technology that does all the boring numbers-crunching for you, allowing you to focus on what matters — the story your business and/ or customer data is telling. Interesting idea, indeed. The question is where did it all start? Let’s find out.
A Brief History Of Augmented Analytics
Data analysis was once relegated to the realm of the IT department or data scientists in charge of managing specialized data science and machine-learning products. This made data interpretation somewhat inaccessible to the marketing and sales teams within a business. In their report, “Augmented Analytics is the Future of Analytics,” Gartner carves out three distinct time frames that got us from point A (IT-led and modeled data analysis platforms) to Point C (augmented analytics).
-
Phase 1
1990s — The semantic layer-based platforms (e.g., data warehouses) of the late 2010s helped end users access data using common business terms. These tools were driven by power users generally on IT teams because of the complexity involved in data modeling and warehousing. These tools tended to have low adoption rates due to the high level of IT and data analysis expertise needed to manage and run these systems.
-
Phase 2
Mid 2010s — Visual-based data discovery platforms emerged in the mid-2010s and made data analysis and visualization much more accessible to teams beyond the IT department. Sales, marketing and business teams no longer needed a high level of data analytics expertise to access business intelligence and other data. These tools had about a 35% adoption rate because they could be led by business units with less oversight from IT. They include popular platforms like Google Data Studio, Microsoft Power BI and Tableau Desktop.
-
Phase 3
Late 2010s — Augmented Analytics Tools takes visual-based data discovery to the next level. These Machine Learning-led-tools to automate many of the tasks needed to maximize an organization’s understanding of their customer and business data. They provide end-to-end data interpretation functions and, unsurprisingly, the adoption rate is high at over 50%.
Today, Augmented Analytics Tools are like the love child of Data and Jeff Goldblum who can instantly and intelligently interpret large chunks of data, looking extremely dashing the entire time. If you didn’t find that explanation satisfactory enough, read on for an in-depth explanation of how these tools work.
How Do Augmented Analytics Tools Work?
Augmented Analytics Tools use AI/ML to automate the mind-numbing processes required to analyze the staggering amount of data generated by businesses and customers. In short, it’s like a smart computer brain that produces meaningful insights for humans.
Key features driven by ML of automated analytics software include:
-
Automates the preparation of data
including data profiling/ quality tasks using machine learning models. Perhaps one of the most important features of Augmented Analytics Tools, augmented data preparation uses ML capabilities to complete various data preparation tasks like automated joining, matching, profiling and tagging as well as data annotation and automating the repetitive processes inherent with data transformation/ integration.
-
Automates data forecasting and predictions.
-
Automatically matches and optimizes algorithms
to fit the most appropriate use case(s) — this includes adjusting an algorithm’s hyperparameters with the help of ML.
-
Automates data segmentation
again, with the help of ML. Automated Analytics Tools use ML to identify segments and clusters within a dataset.
-
Automates alerts/ notifications & reporting
which uses ML to proactively inform users of data anomalies, changes and outcomes. Provides descriptive insights on data correlations, variances and trends in natural language (it also knows how you take your coffee!).
Why Do We Need Augmented Analytics Tools?
Augmented Analytics Tools can help businesses better analyze and use their data. This is important because less than .5% of data is leveraged by businesses and only 12% of enterprise data is used to make decisions. Augmented Analytics Tools can ease data bottlenecks and make business data more accessible to all teams within an organization without the need for IT/ data science expertise. It’s kind of like having your own emotionless android to access and analyze data for you, so you can continue to gaze at that photo of Jeff Goldblum, above.
Benefits include:
-
Increases productivity and efficiency of data preparation and discovery by 50-80%.
-
Automates data science tasks and improve data model accuracy by removing bias.
-
Automate visualization of relevant patterns and provide faster data insights (e.g., reduce cycle time from query to insights).
-
Improve data accessibility for teams without the need for specialized training or skills in data analysis.
-
Help human users share insights and data findings across the organization.
The Future Of Augmented Analytics Tools
The global augmented analytics market is predicted to reach about $30 billion by 2027. Businesses understand that data is only useful if it is accessible and that automating the tasks inherent in creating actionable business insights requires robust AI/ML capabilities.
The amount of data being generated by IoT devices, computer systems, marketing channels, websites, Ecommerce platforms and more is staggering. Augmented analytics can help businesses access this data quickly and make faster decisions that drive growth, paving the way for future opportunities.
Frequently Asked Questions
What are Augmented Analytics Tools?
Augmented Analytics Tools harness the power of Machine Learning (ML) and Artificial Intelligence (AI) to interpret and analyze data. They automate the process of data preparation, insight generation, and explanation, making data analysis more accessible and intuitive for users. Essentially, these tools act as intelligent assistants, deciphering complex data sets and providing actionable insights to help businesses make informed decisions. By leveraging ML and AI, Augmented Analytics Tools streamline the data analysis process, allowing users to focus on deriving meaningful insights from their data without requiring extensive technical expertise.
How do Augmented Analytics Tools work?
Augmented Analytics Tools utilize AI and ML algorithms to automate various aspects of data analysis. These tools automate data preparation tasks, such as data profiling, quality assessment, and transformation, using machine learning models. They also facilitate data forecasting and predictions by automatically selecting and optimizing algorithms to fit specific use cases. Furthermore, Augmented Analytics Tools employ ML to identify data segments and clusters, automate alerts and notifications, and generate descriptive insights in natural language. By leveraging advanced analytics capabilities, these tools streamline the data analysis process, enabling users to extract valuable insights from their data more efficiently.
Why do businesses need Augmented Analytics Tools?
Augmented Analytics Tools play a crucial role in helping businesses effectively analyze and utilize their data. Despite the abundance of data available, a significant portion remains untapped, limiting its potential impact on decision-making processes. These tools address data bottlenecks by automating data analysis tasks and making data more accessible to all teams within an organization, regardless of their technical expertise. By automating data preparation, discovery, and visualization tasks, Augmented Analytics Tools enhance productivity and efficiency, allowing businesses to derive insights faster and make data-driven decisions with confidence. Additionally, these tools help mitigate bias, improve data model accuracy, and promote collaboration by facilitating the sharing of insights across the organization. Overall, Augmented Analytics Tools empower businesses to harness the full potential of their data, driving growth and innovation in the digital age.
Tue, May 31, 2022

Enjoyed what you've read so far? Great news - there's more to explore!
Stay up to date with the latest news, a vast collection of tech articles including introductory guides, product reviews, trends and more, thought-provoking interviews, hottest AI blogs and entertaining tech memes.
Plus, get access to branded insights such as informative white papers, intriguing case studies, in-depth reports, enlightening videos and exciting events and webinars from industry-leading global brands.
Dive into TechDogs' treasure trove today and Know Your World of technology!
Disclaimer - Reference to any specific product, software or entity does not constitute an endorsement or recommendation by TechDogs nor should any data or content published be relied upon. The views expressed by TechDogs' members and guests are their own and their appearance on our site does not imply an endorsement of them or any entity they represent. Views and opinions expressed by TechDogs' Authors are those of the Authors and do not necessarily reflect the view of TechDogs or any of its officials. While we aim to provide valuable and helpful information, some content on TechDogs' site may not have been thoroughly reviewed for every detail or aspect. We encourage users to verify any information independently where necessary.
Loading comments...